DCP 3.0: A Mentor's experience of the final module
November 12, 2025 by Himesh R
Learning about data pipelines, witnessing grant pitches, and gaining insights into opportunities and challenges for NGOs in executing a data strategy.
The Data Catalyst Program (DCP) 3.0 once again brought me to Mirage Hotel, Mumbai for its second and final workshop from November 3-5, 2025. I met up with Anto at the airport, and since both of us felt like walking all the way from the airport to our hotel, a short distance of just 1.5 kms, we did just that, navigating some deadlocked traffic and scarce footpaths. At the hotel lobby, I met Athiruban, from my mentee organization Sristi Foundation and we were both excited to pair on our Grant Pitch presentation.
Day 1: Grant Pitch Preparation
Afternoon: Pairing on the Grant Pitch presentation
The first day afternoon was a productive working session with Athiruban, focusing on structuring the problem statement and solution for Sristi Foundation's grant pitch.
We worked through their presentation, identifying redundancies—particularly a duplication between their long-term impact section and the way forward. Consolidating these into one compact, powerful statement made the pitch significantly stronger.
We then reviewed all the slides and referenced the Grant Pitch template to identify gaps in our presentation. We also added a section on the expected outputs and outcomes of the project.
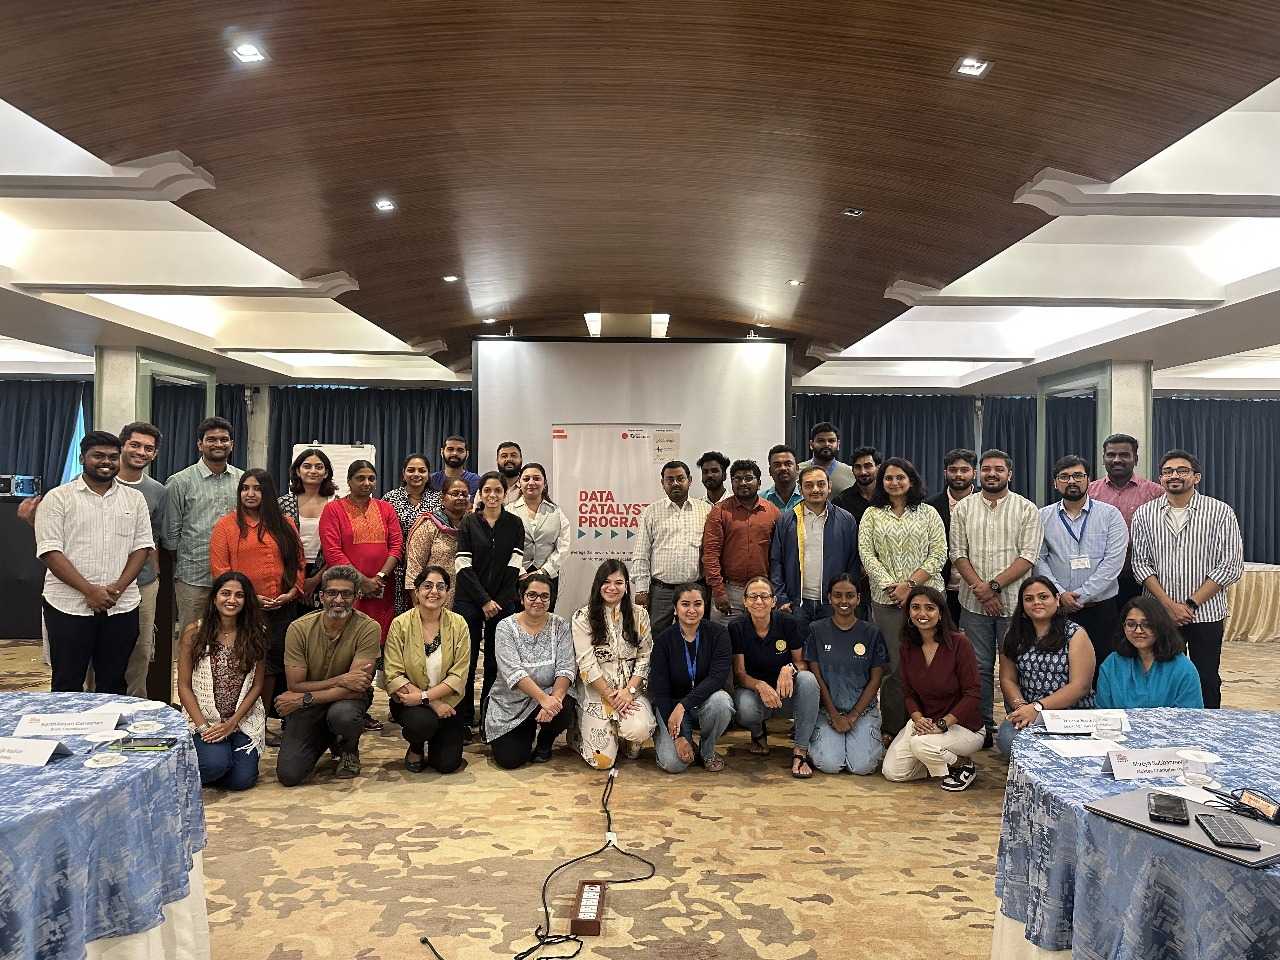
DCP 3.0 - Module 2 Group
Evening: Scoring and Socializing
Later that evening, Mentors completed the scoring for their mentee organization with detailed reasoning for their scores. This scoring would account for 40% of the final grant decision, which would be crucial in deciding the Grant winner.
Rest of the evening was spent socializing with several participants of the DCP 3.0 cohort. Meeting other mentors and organization representatives face-to-face after months of virtual interactions added a human dimension to the program that had been missing in our remote check-ins. We talked about food from different parts of the country, asked some party questions like "What's my hidden talent?", etc. to get to know each other better.
Day 2: Technical Deep Dive and Learning Sessions
Day 2 morning was packed with hands-on technical sessions.
A mini Data Pipeline Building exercise
The morning kicked off with an engaging session conducted by Prateeksha from Project Tech4Dev. We learned about the fundamental building blocks of data pipeline:
- Data Collection: Gathering information at the source
- Data Transformation: Cleaning and structuring raw data
- Data Integration: Combining data from multiple sources
- Data Storage: Maintaining data securely and efficiently
- Data Visualization: Presenting insights for decision-making
We then did a mini exercise on building a data pipeline. The session demonstrated a practical approach to data cleaning: taking data from simple spreadsheets as input, using AI models to generate AppScripts code using well-crafted prompts, and then scheduling automated cleaning processes leveraging built-in capabilities of AppScripts. We also did simple visualization on the cleaned data using LookerStudio.
On assessing Avni as per this data pipeline, it was evident to me, that our platform encompasses all those steps, albeit with a minor difference. Avni’s approach to data collection enforces required validations upfront, which ensures data quality at entry and eliminates need for data cleaning or missing value imputations later on.
What struck me most was the accessibility of the solution. No complex infrastructure needed—just Google Sheets, public AI Models, AppScripts and LookerStudio. This was exactly the kind of practical, low-barrier solution that many NGOs in our cohort could consider as a starting point for their data transformation journey.
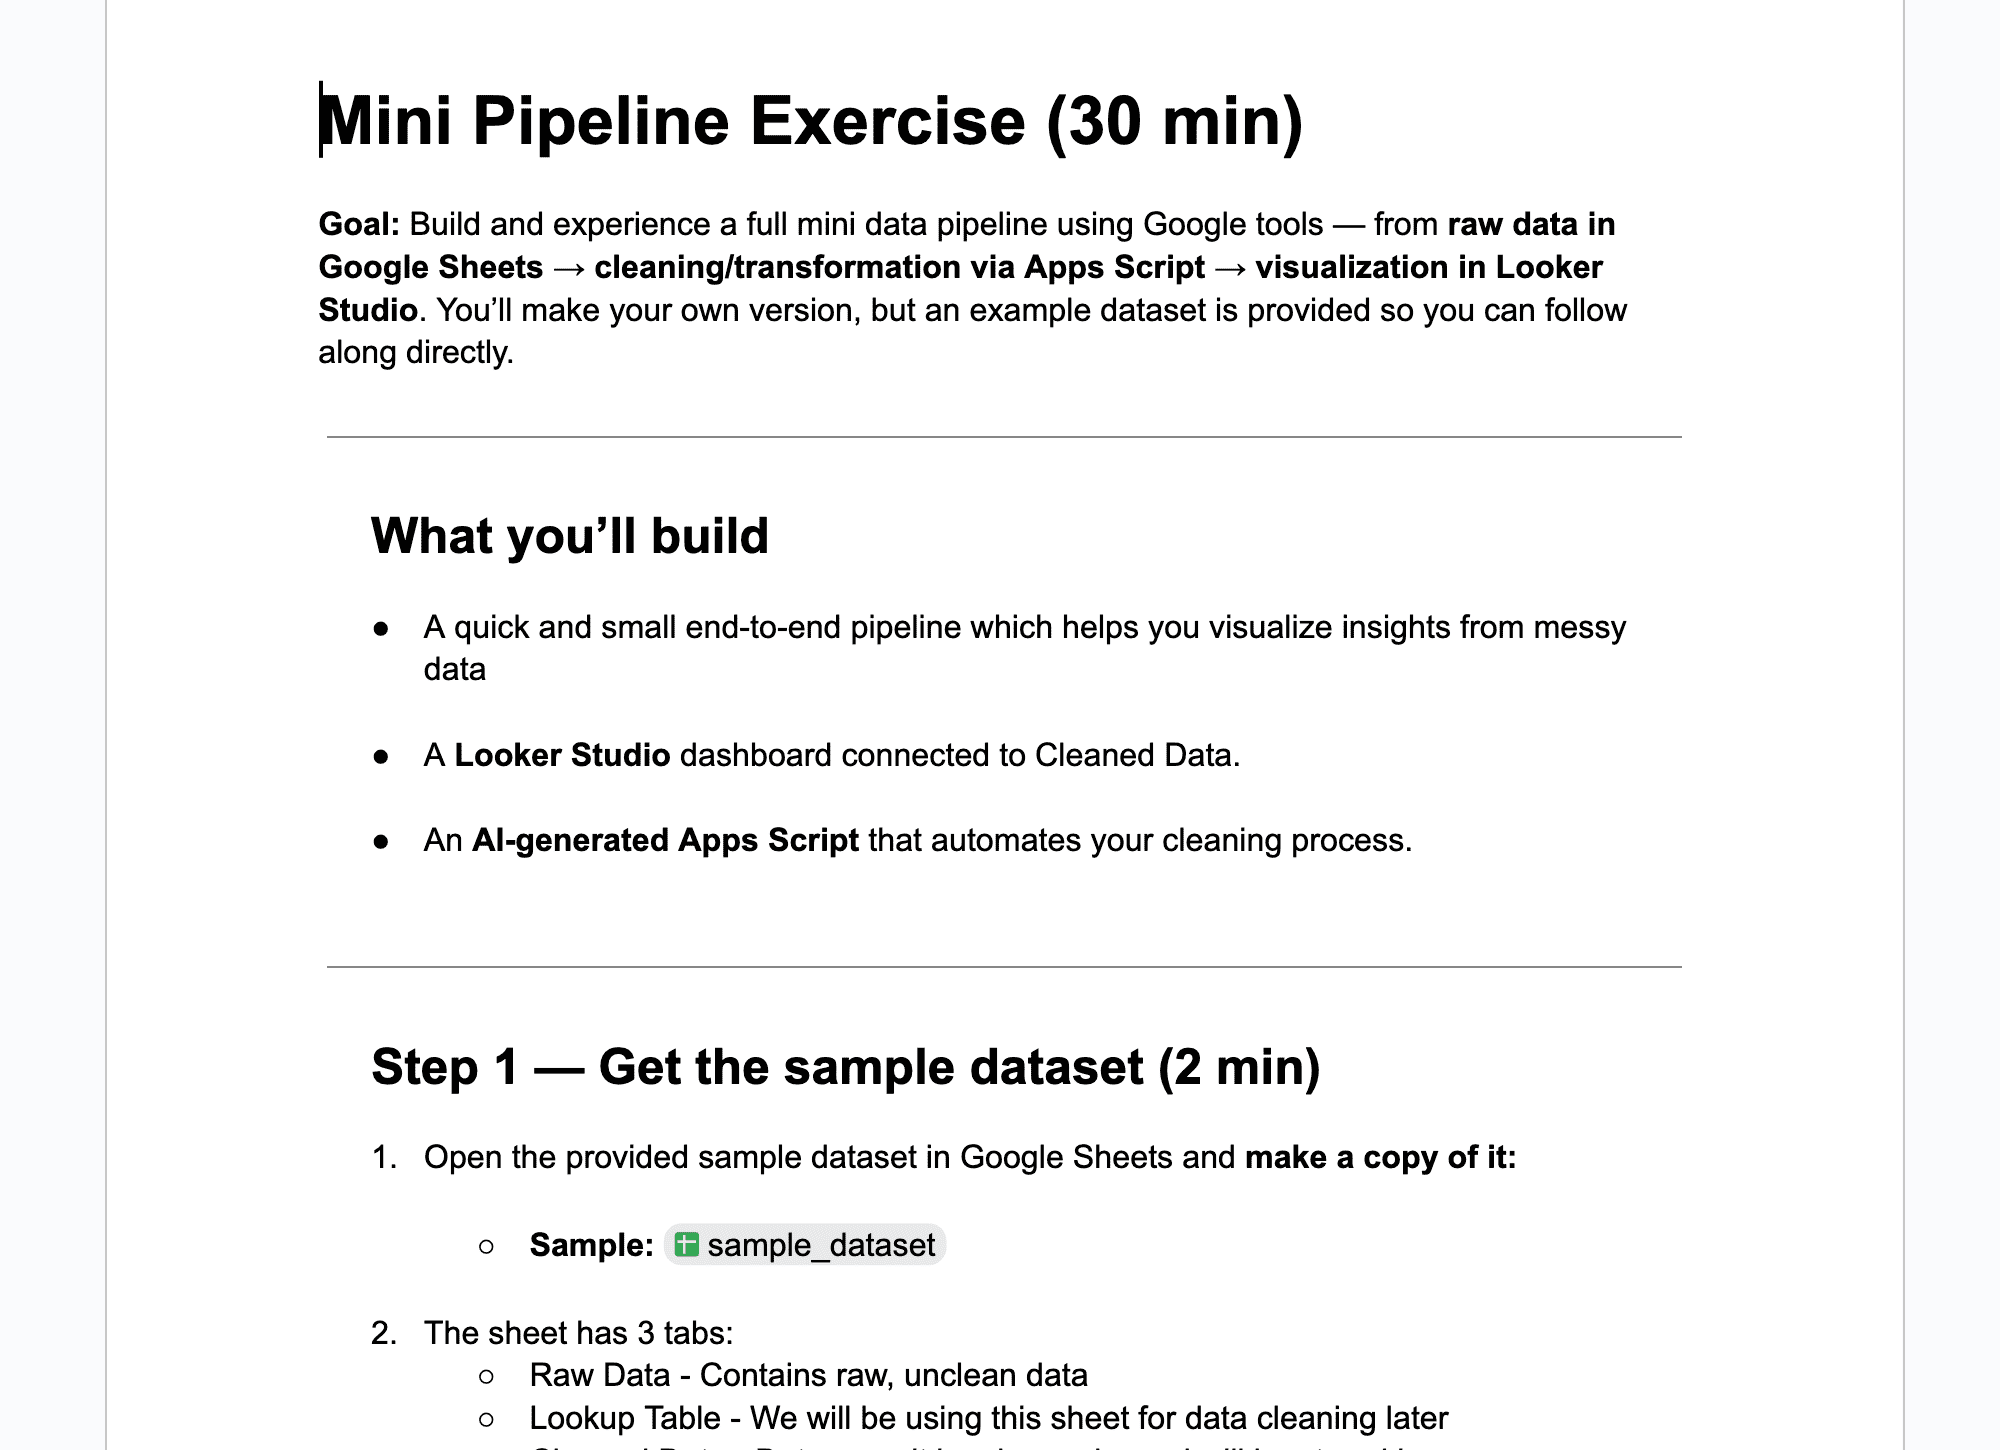
Data Pipeline Building Mini Exercise
Data Pipeline Plumbing
The next session, conducted by Stuti from Project Tech4Dev, focused on "Identifying the Weakest link in our Data-pipeline and solving for it".
Steps involved were:
- Document the tools currently used and user groups impacted
- Identify the weakest step in our mentee organization's data pipeline
- Come up with a plan to improve the weakest step
- Envision improved outcome by addressing the weakest link in the data pipeline
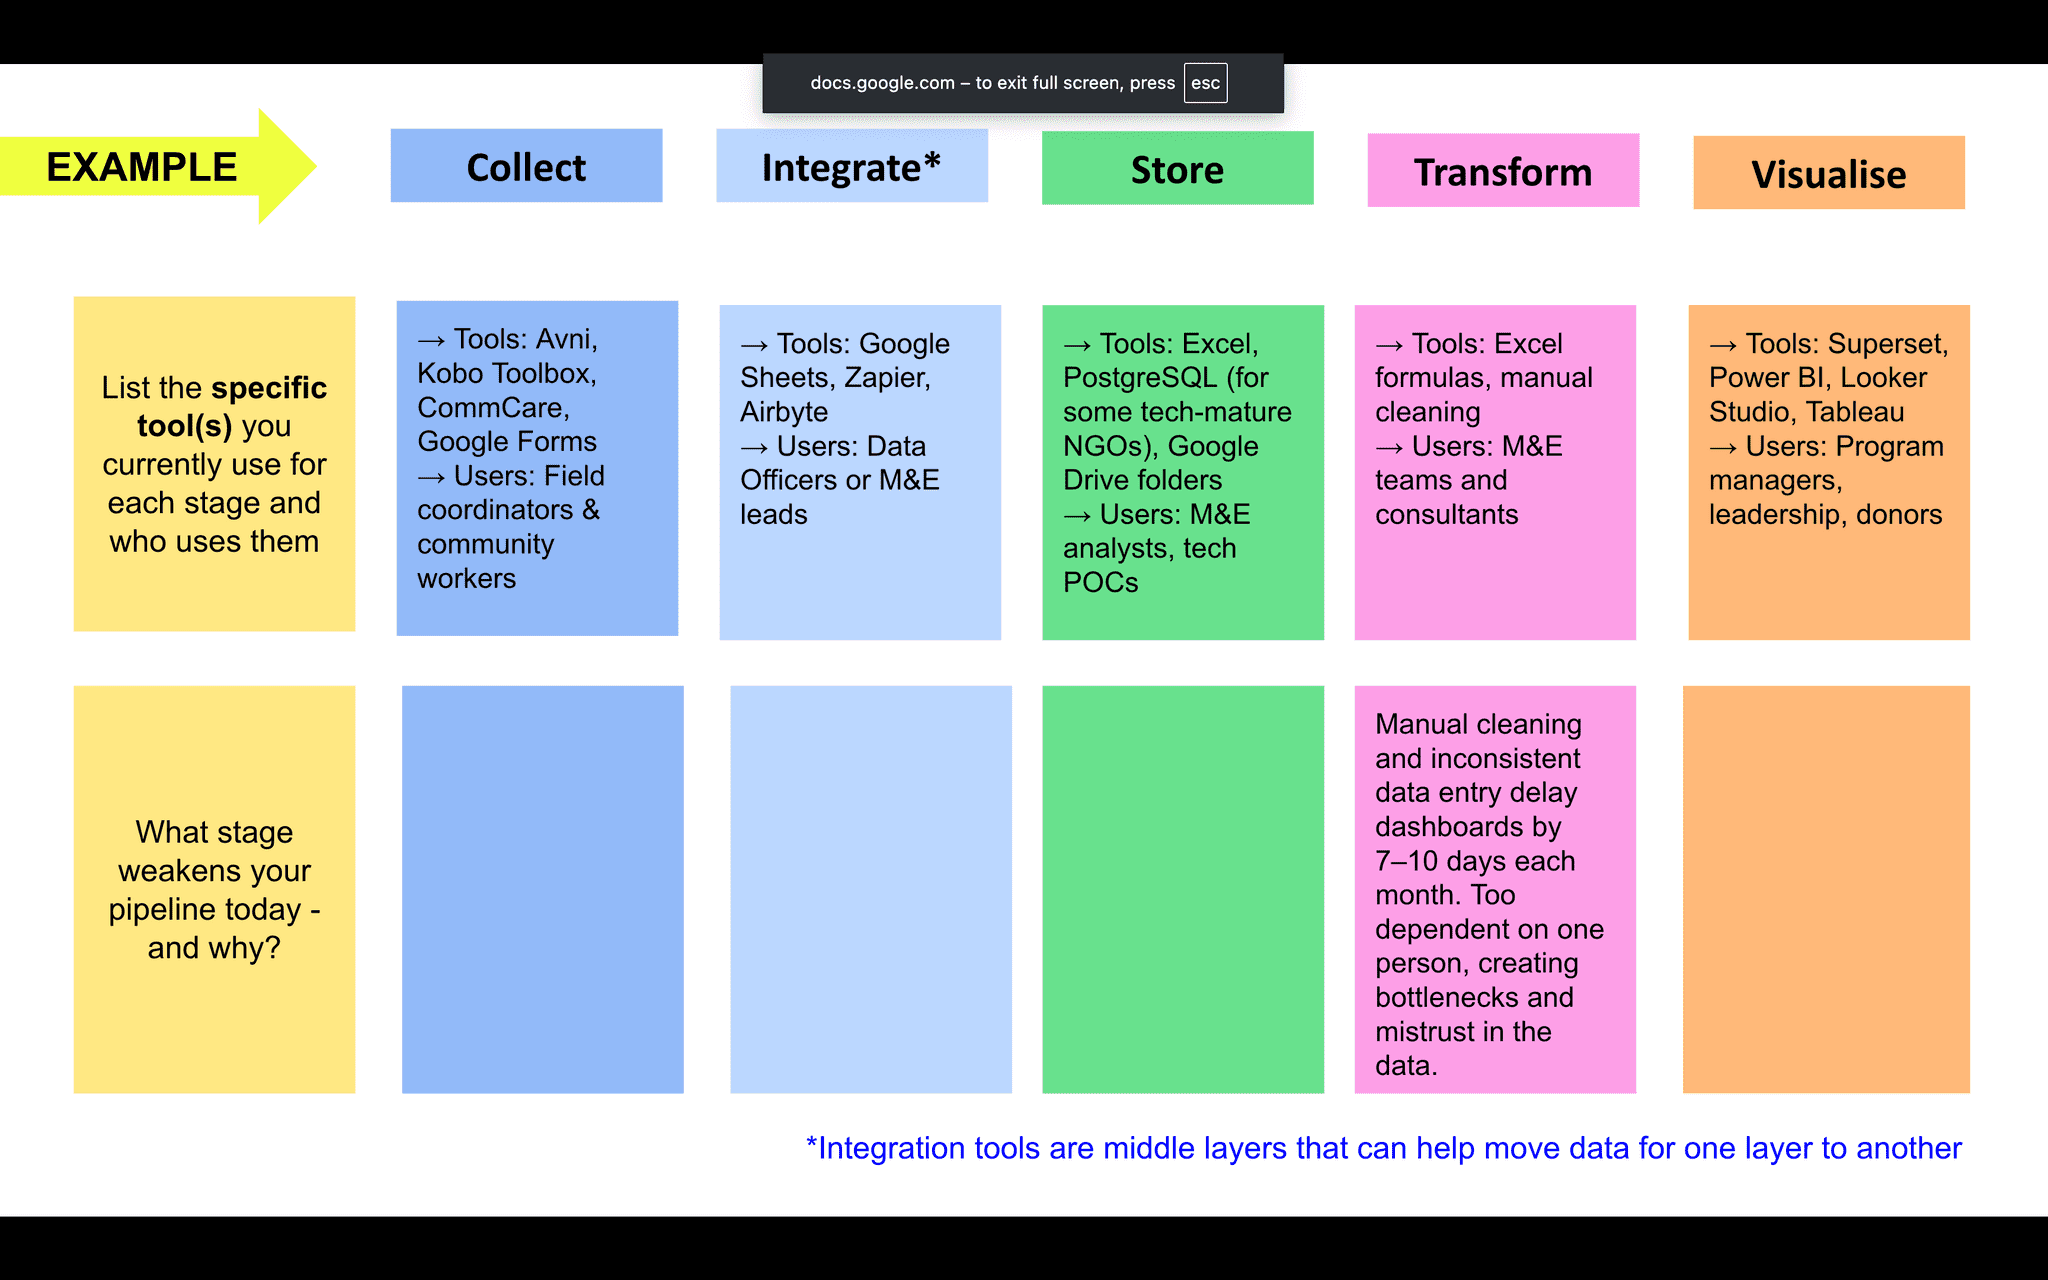
Identifying the weakest link in our organization's data pipeline
Building Performant Dashboards
The final Tech session for the day by Jishnu from Goalkeep was a technical masterclass. He walked us through the entire data pipeline in detail.
The different types of tables at various pipeline stages:
- Staging tables: Raw data landing zones
- Intermediate tables: Cleaned and joined data
- Fact tables: Aggregated, analysis-ready data
Key Insight: Performant dashboards rely on well-designed "Fact" tables with three types of columns—Cardinality (unique identifiers), Dimensions (categorical data for filtering), and Numeric metrics (measurable values).
We started off with a collective group exercise building a Fact table that could be used for a Performant Dashboard. The structured approach to do this involved the following steps:
- Identifying the metrics needed for the dashboard
- Fixing the Cardinality for each row (unique identifier)
- Identifying the Dimensions (categorical data for filtering)
- Identifying the Numeric metrics (measurable values)
- Coming up with pseudo queries to determine the metrics by applying filters and aggregation functions on the fact table columns
We then worked through an additional problem independently. This hands-on exercise further cemented the learning far better than any lecture could have.
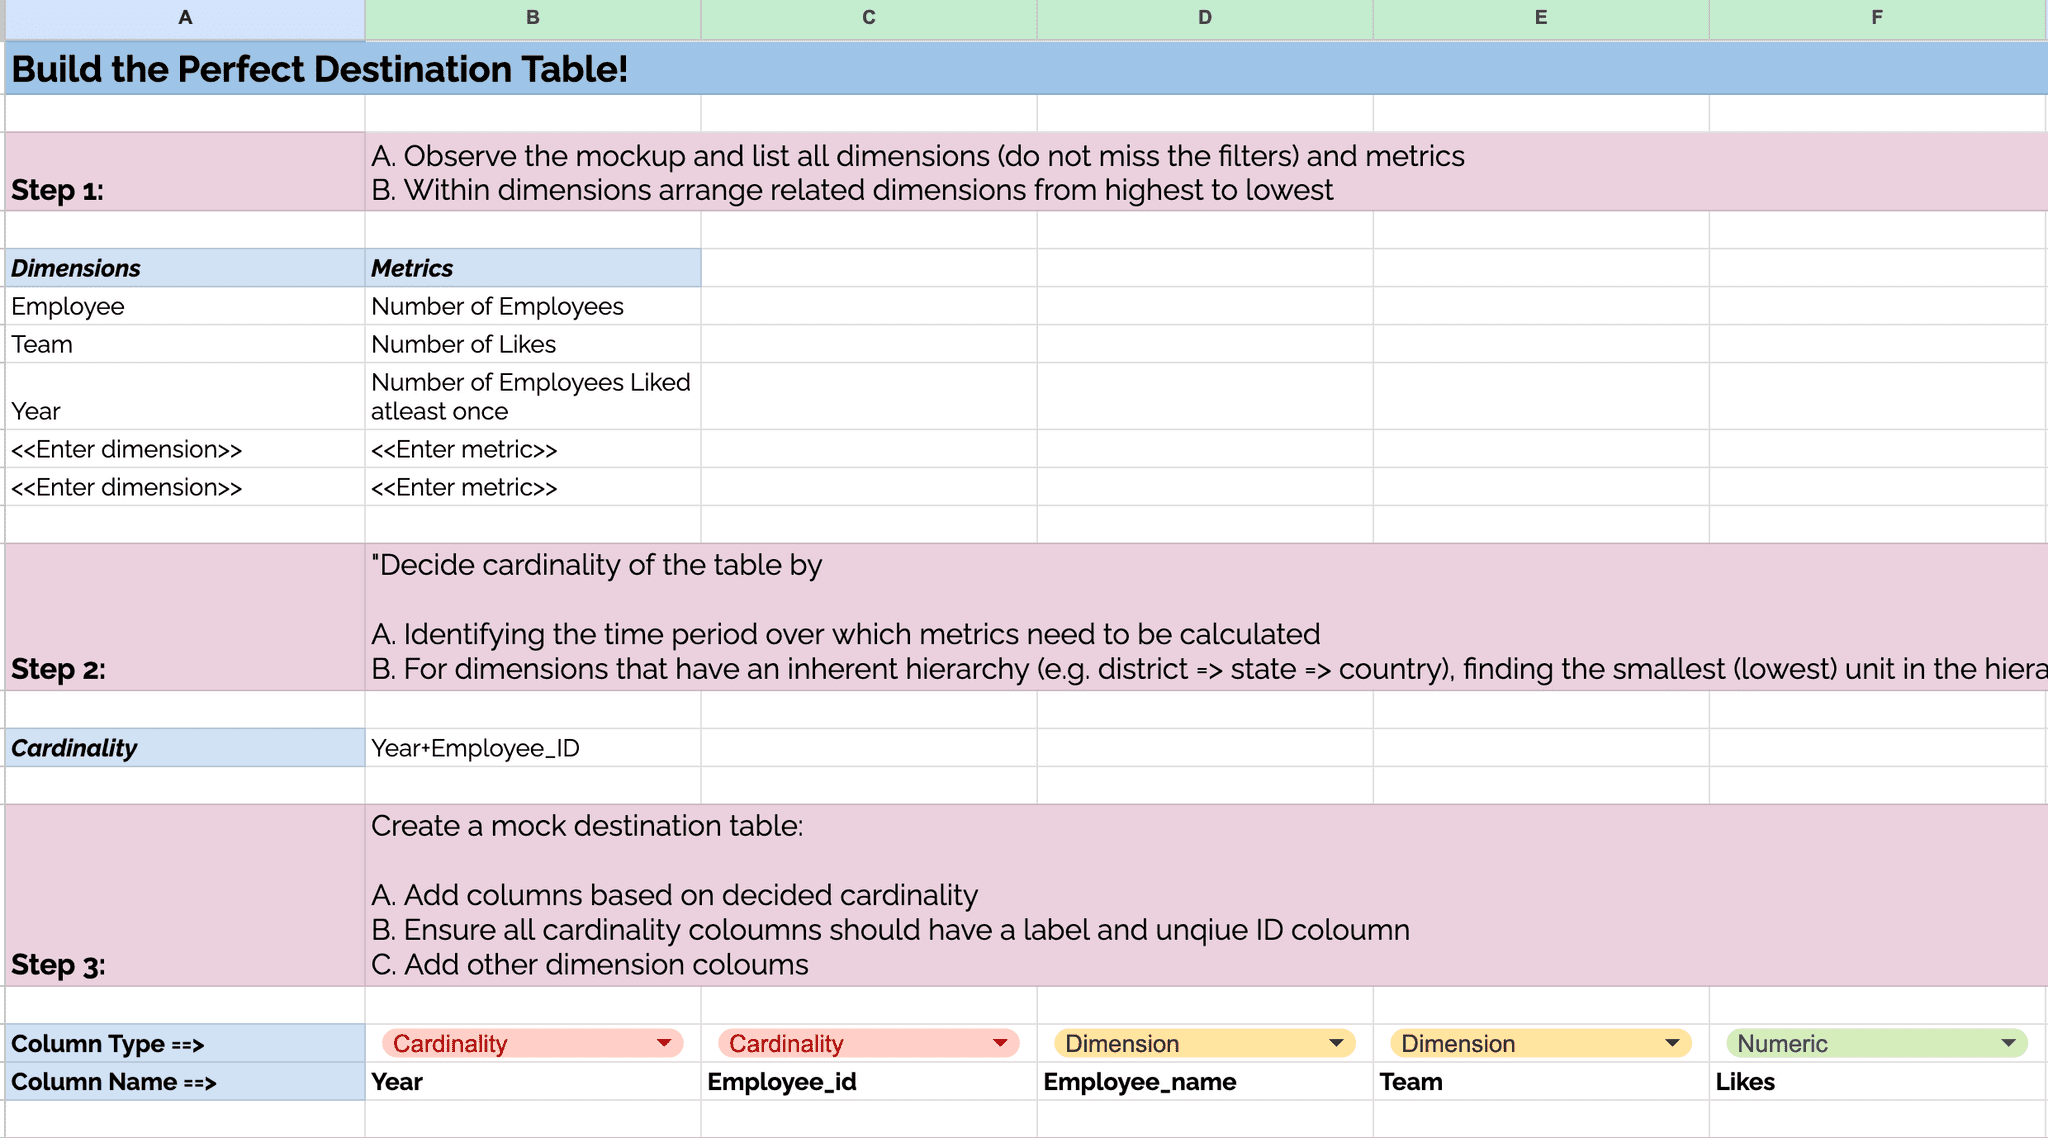
Building a Fact Table for performant dashboards - Group exercise
Final Pitch Polish
The second half of the day brought me back together for a Pairing session with Athiruban to finalize Sristi Foundation's grant pitch. After incorporating the feedback from Day 1 and adding clarity around our problem statement, solution, feasibility, cost breakdown, expected outcomes and outputs, the presentation felt crisp and precise.
I felt cautiously optimistic. The pitch wasn't perfect—our progress over the four months had been limited by the NGO's bandwidth constraints—but it honestly reflected what we'd learned and what was realistically achievable in the near future.
Stepping out of the hotel
Athiruban and I then went out for an outing to visit Mahalakshmi Temple in Mumbai. We were ably guided by my dear friend Vedant. We used the Aqua line Metro as the primary mode of transport for the night. After a surprisingly quick darshan, we headed to Churchgate for a Mumbai Pav Bhaji and Vada-pav meal. We were also treated to some Rustom Ice Cream Sandwiches, which literally melted the moment I bit into them. One night out helped me check off all items from my bucket list of visiting Mumbai.
Day 3: Grant Pitches and Celebrations
The Scoring Marathon
Most of the day was spent evaluating grant pitches from all 13 participant NGOs. As each organization presented, I found myself curious to know more about each organisation's journey where they are at and where they were headed to. Several presentations showed genuine promise about making meaningful progress in their data journey based on learnings and a clear future pathway.
The Pitches That Stood Out
Well Labs: The Food Delivery Analogy
The most innovative approach Grant Pitch came from Well Labs, who explained their problem statement using a brilliant food delivery app analogy. Their example featured two models: "Granny's Home Cooked Meals" (curated, secret recipe) and an "Open Recipe Restaurant" (standardized, public recipe). This creative explanation made their complex data governance challenge easier to understand.
What impressed me most was the sustainability and feasibility aspects of their solution. They had crafted a strategic process that would generate consistent outputs, that were valuable not just internally, but also for organizations outside their network.
Sristi Foundation: A Pleasant Surprise
Athiruban had a calm and composed demeanor during the pitch, that commanded attention. He articulated the problem statement and solution clearly and aptly responded to questions during the Q&A section with thoughtfulness and confidence.
Nayi Disha: Starting With a Bang
Nayi Disha's presentation started with a bang. They opened with a real story: one of their service users had made nearly 70 calls to their helpline, each time having to re-explain her entire context because information wasn't shared across teams.
That single example made their problem statement and solution crystal clear—they needed a unified platform that would create a seamless experience for beneficiaries throughout their engagement with the organization.
Maitrayana: "Cute" and Avni-Focused
Maitrayana's presentation was delivered as a video recording, which was endearing in its own way. They spoke enthusiastically about leveraging Avni for their data collection needs and Metabase for visualization, while pitching for grant funds to adopt Glific to capture qualitative data from beneficiaries during and post-program engagement.
As member of the Avni team, it was gratifying to see an organization using our platform as a core part of executing their data strategy.
Sustainability and Future-proofing your Data journey
The final technical session by Abhishek from 10X Impact Labs was on building data strategy with sustainability goals in mind from the outset, not as an afterthought. The group exercise was based on learning from a case study on SAFA, a Hyderabad-based non-profit organization. We went through some starter exercises on identifying challenges with sustainability of our organization's data strategy and categorizing them as follows:
- User Adoption
- Tech and Maintenance
- Data Quality
- Funding
- Others
We then went through another exercise, to come up with an action plan to address those challenges with specific details like:
- Action
- Action owner
- Timeline
- Resources required for it

Action Planning exercise for addressing sustainability challenges
Key Takeaway: Long-term challenges with any data strategy are inevitable, but they can be significantly mitigated by keeping sustainability goals in focus from the very beginning.
And the Winner Is...
Finally, the moment of truth arrived. After all the presentations, peer scoring, and mentor evaluations were tallied, the DCP 3.0 grant winner was announced: Nayi Disha.
The result aligned with my expectations. Their presentation was stellar and their technical approach was sound. The progress made over the four months was deemed authentic, based on the scores given by their mentor. They had successfully leveraged an in-house tech team to build a custom data collection app tailored to their specific needs while adopting Apache Superset for visualization—a pragmatic solution.
More importantly, they had demonstrated something many organizations struggle with: the ability to execute on their data strategy commitments with dedicated resources and clear leadership buy-in.
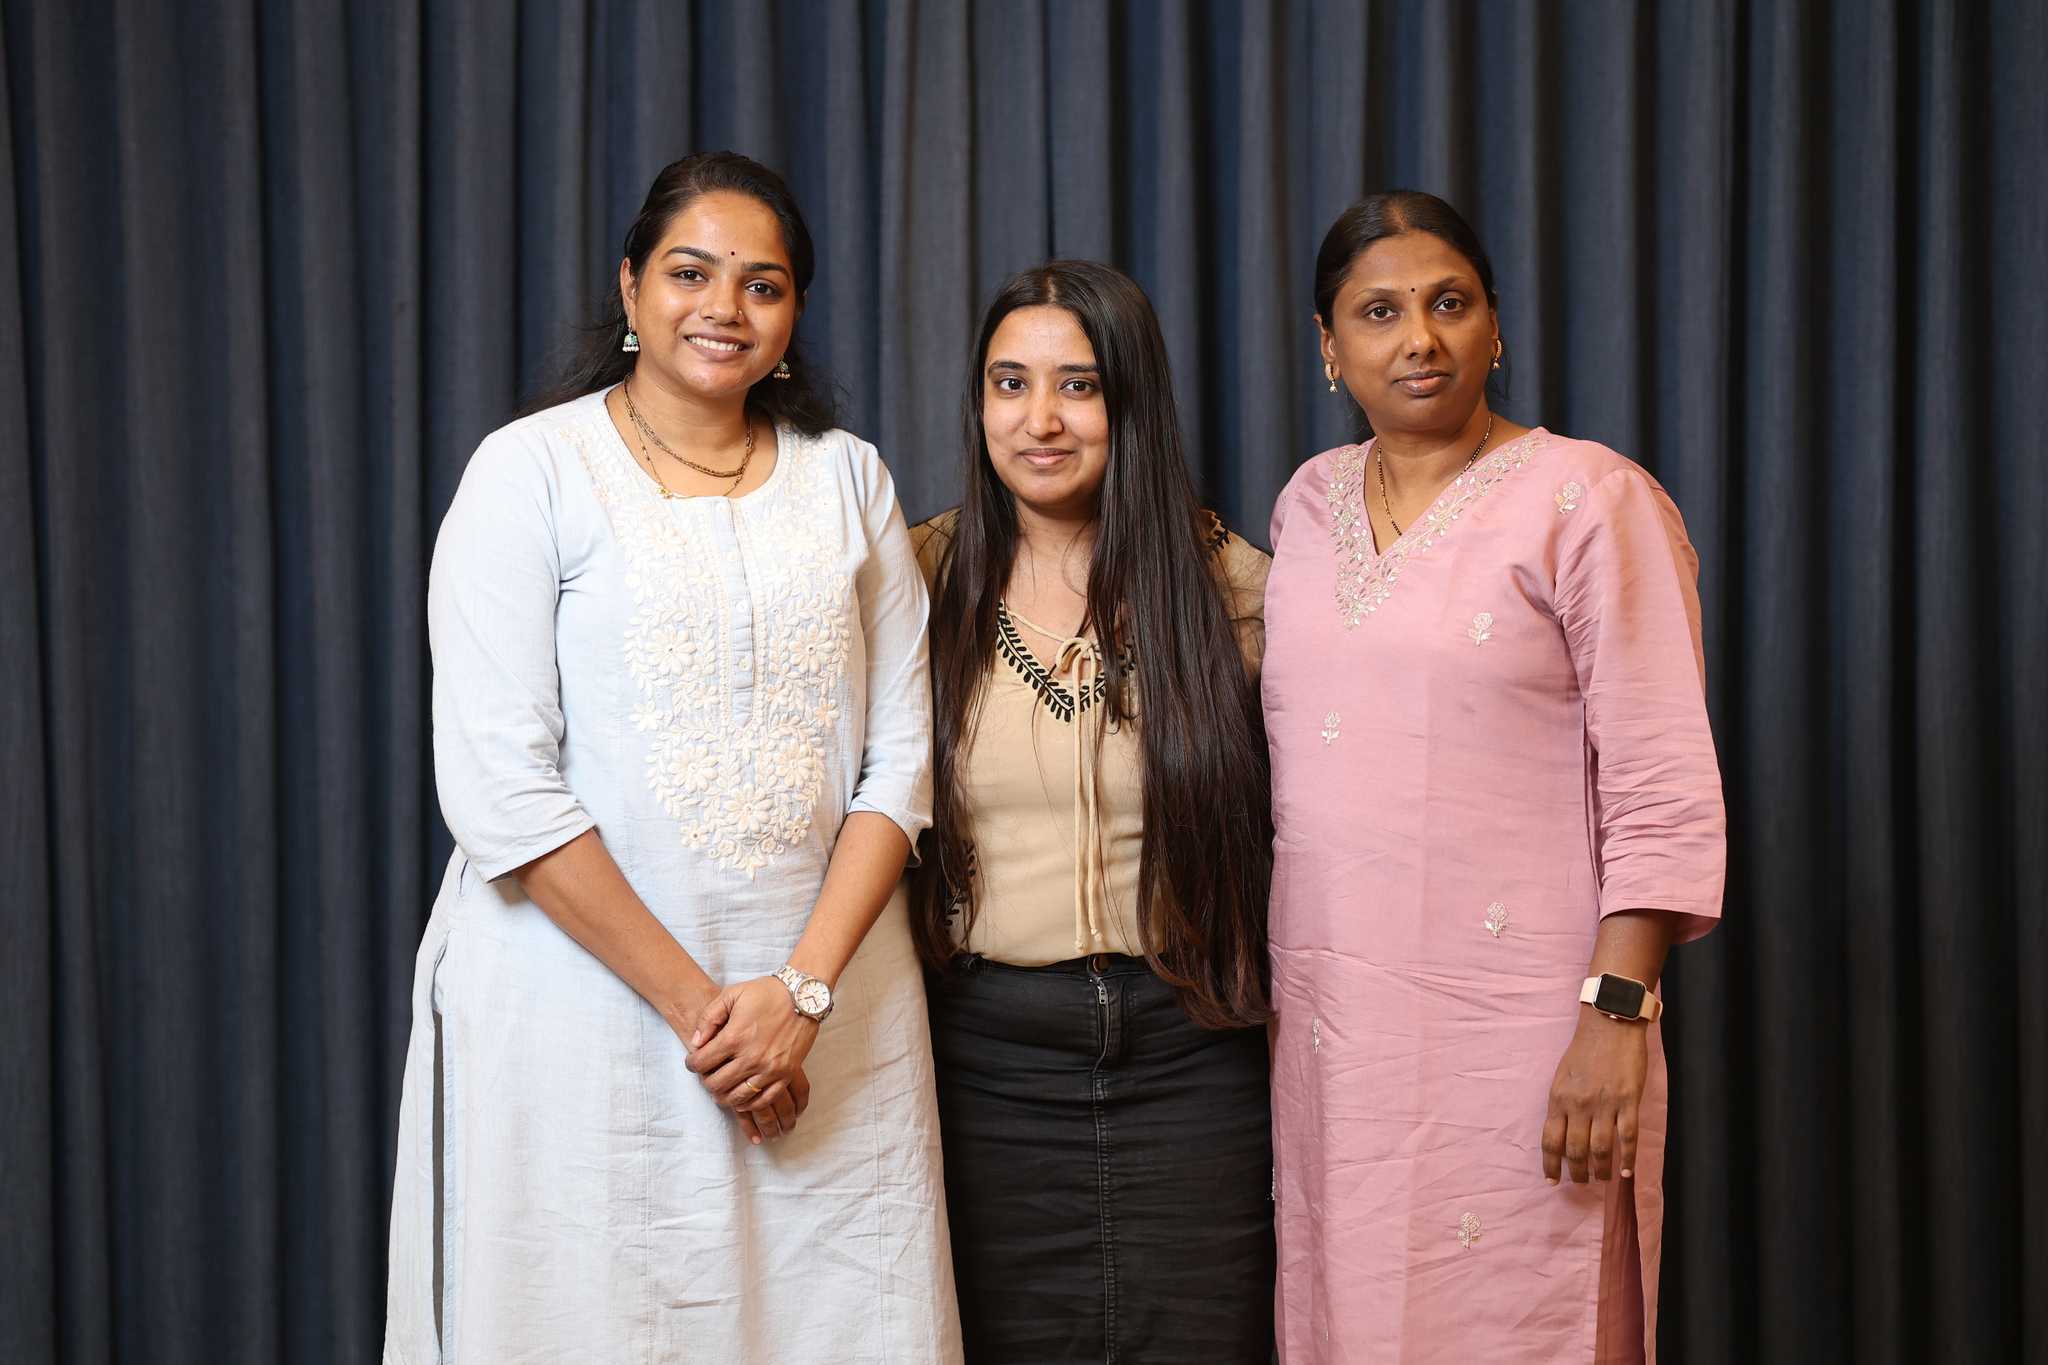
Nayi Disha team and their Mentor
Reflections and Gratitude
To the Organizers
The DCP 3.0 organizing team—Lalit, Freya, and Ashana—deserves special praise. They worked seamlessly together, making the entire four-month journey smooth for everyone involved. Their responsiveness to issues and genuine interest in enabling organizations to leverage DCP 3.0 tools and processes was commendable.
To the Technical Facilitators
I personally gained immense value from the technical sessions conducted by Jishnu from Goalkeep. His ability to blend theory with practical examples was exceptional. The hands-on exercises gave us confidence that we could apply these concepts independently.
Key Learnings About NGO Data Challenges
My DCP 3.0 journey and the Grant Pitch sessions revealed some patterns worth reflecting on:
The Visualization-First Impulse
Several organizations had jumped straight to dashboards and reports without solving fundamental data collection and transformation challenges. It's an understandable impulse—everyone wants to see pretty visualizations. But building dashboards on unstable data pipelines is not sustainable in the long run.
The Generic Data Collection Tools Trap
Few organizations remained stuck with generic, non-scalable tools like Google Sheets or Forms for data collection. These tools are comfortable and familiar, but they don't scale, they don't enforce data quality, and they don't support complex workflows. The reluctance to invest time or effort in purpose-built solutions—whether it's Avni, KoboToolbox, or custom applications—limits what's possible.
The Resource Allocation Challenge
Perhaps the most universal challenge: time and bandwidth allocation by NGOs. Several organizations struggled to dedicate sufficient resources to execute their Scope of Work from Module 1.
As my Yoga teacher would say, "Showing up on the mat every day is all that matters!". If organizations commit to their data strategy and take small baby steps every day (or week), they will get there eventually.!
Closing Thoughts
I'm grateful to have been part of the DCP 3.0 journey—both as a mentor and as a Product Developer of a Data Collection Tool built for the Social Development Sector. The lessons from the DCP 3.0 journey will influence how I think about data strategy, leadership, and sustainable change in the sector for years to come.
P.S. At the end for me, there was a dramatic run through the Mumbai Airport to get on to the plane, but that's a story for another time. ;-)
